



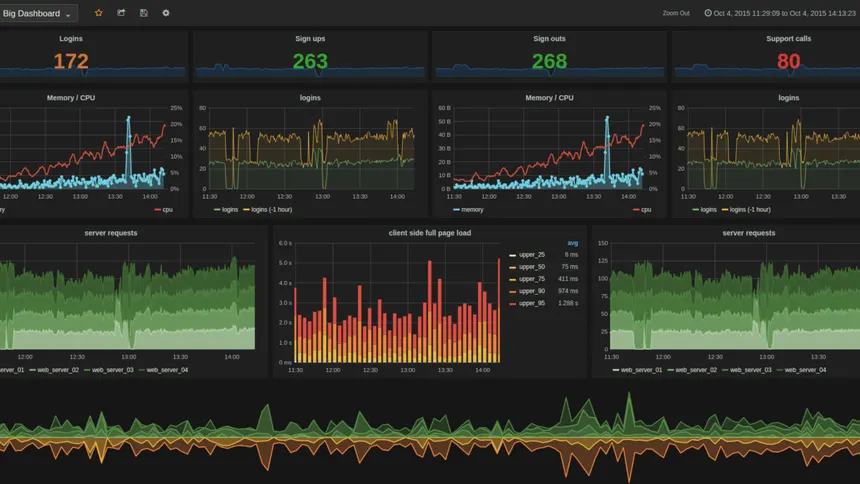
Suppose you are building a production grade application where you have thousands of active users, suppose an e-commerce platform like Amazon, then suddenly your application got slow, some functions i.e. add to cart is not working. As a developer what will you do here, you will check logs, check if the server is down, CPU overload, memory leak, and logs. Do you think logs tells you what actually is happening, Nope, You will be left with no clue, you will get stuck with digging terminal output or SSH-ing into servers like a detective without a torchlight.
Prometheus and Grafana are like your app’s doctor and dashboard respectively. here the record of how well your system is performing to ensure the best resource utilization and to optimize the application performance. So, Prometheus and Grafana comes into a picture, Prometheus collects metrics and send alerts, on the other hand Grafana visualizes it is the beautiful dashboard. Together they bring the magical power to control your system before it impact on users operations.
Definition:
Prometheus: Prometheus is a open-source tool used to monitor system, applications and devices. It collects metrics like CPU usage, memory, request latency, error rates, etc. from your app and server. Stores them in a time series database, and lets you set alerts when something goes wrong. It is like a spy that keeps track of everything.
How it works: It scrapes (pulls) data from your app at regular intervals (like every 10 seconds) and stores it in a time-series database. Time-series means it tracks how metrics change over time, like a graph of your app’s heartbeat.
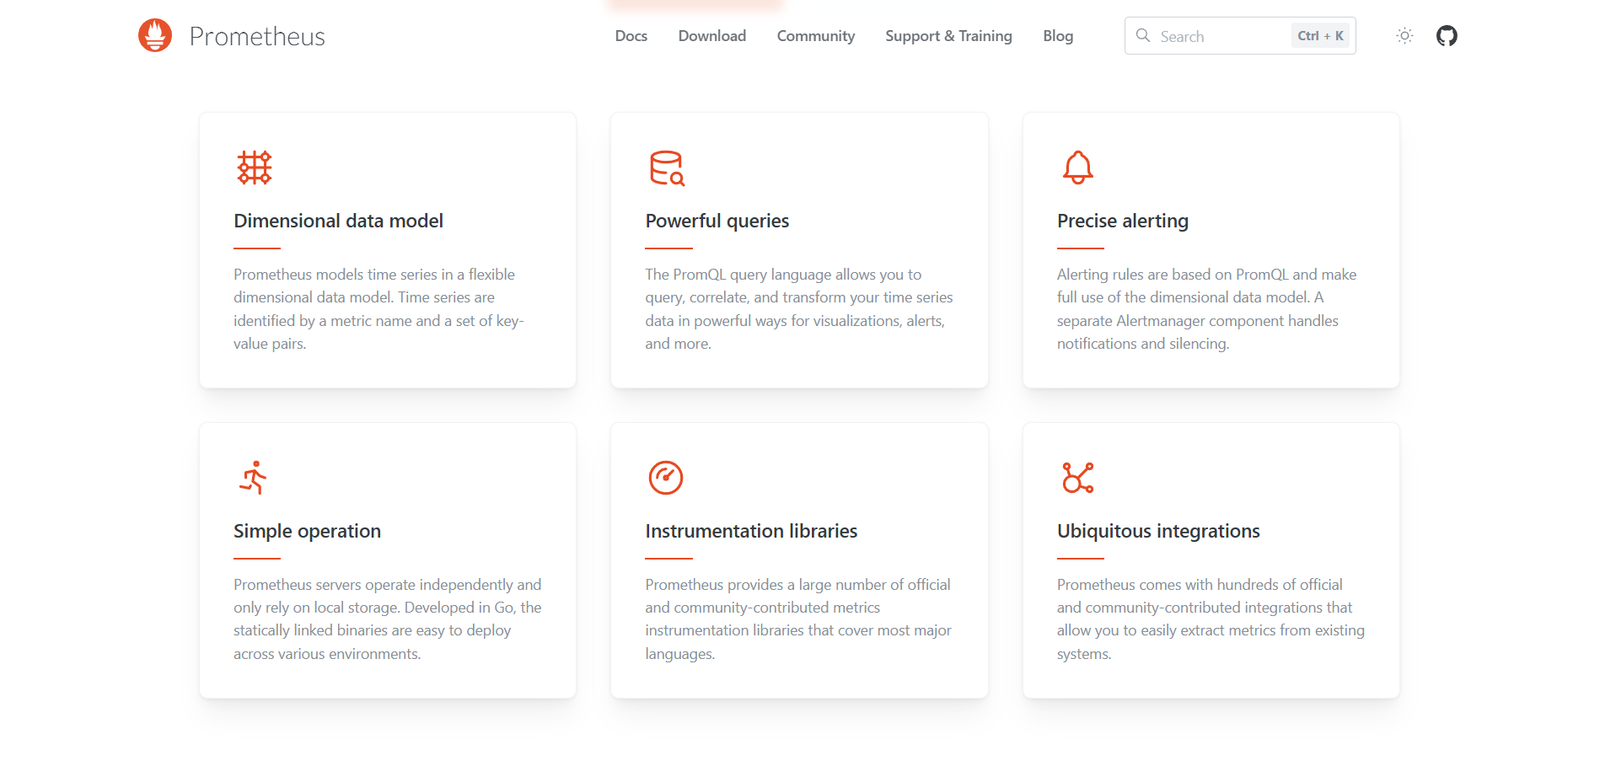
Grafana: Grafana is a fee, open source tool which is the visual representation of our system performance in real time through graphs, charts, and alerts. It’s like the TV screen showing your app’s health in real-time.
How it works: You connect Grafana to Prometheus, and then you create dashboards to visualize metrics. You can customize it to show exactly what you care about.
Why it’s cool: It’s user-friendly, supports multiple data sources (not just Prometheus), and lets you set up alerts (like, “Ping me on Gmail if CPU usage > 80%”).
Prerequisite:
Before you start you need to ensure:
- You have a runnable project.
- Docker to run Grafana and Prometheus.
Why Use Grafana?
It pulls data from different source (Prometheus, MySQL , elastic search) then show it in beautiful dashboard.
It helps you to monitor your system ( e.g. Server CPU usage, app response time, database queries)
You can set alert to know when something goes wrong, like if your server is about to crash.
It is fully customizable so you can make dashboard that fit your app’s needs.
Setting up Prometheus dependency on spring Boot project to enable monitoring of your system.
Add the below dependency on you pom.xml / build.gradle.kts (if you are using gradle-kotlin):
Dependencies: Spring Web, Spring Boot Actuator, Micrometer Prometheus

- Actuator Dependency enables endpoint that expose information about your application’s health, metrices, monitoring and configuration.
- If you don’t have Spring web dependency, for your web development and auto-configuration.
- Micrometer dependency is used to configure spring Boot applications to expose metrices in a format that Prometheus can scrape and store.
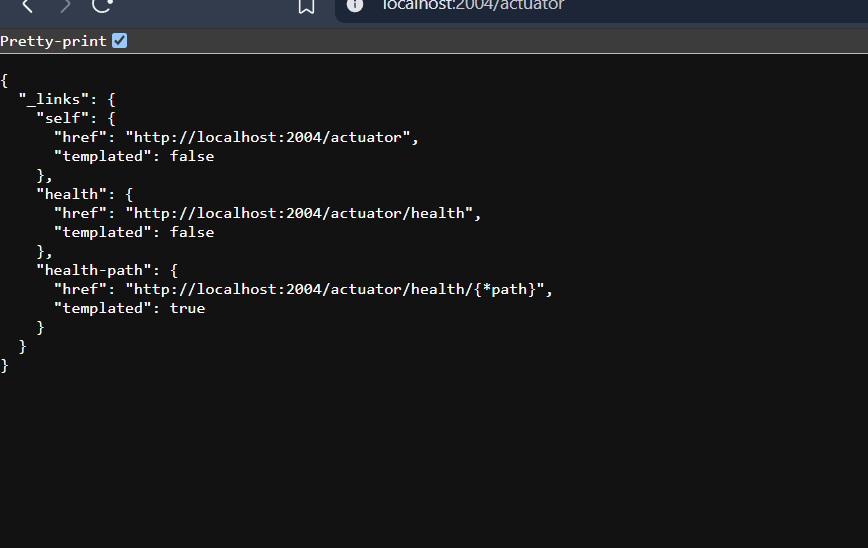
After adding these dependencies, Simply run your application and then make a call “http://localhost:8080/actuator ” you will see the list of health check information as shown in the image below:
Then, enable all the actuator endpoints “management.endpoints.web.exposure.include=*” in our application.properties.
Now if you call http://localhost:8080/actuator endpoint, it will provide you with a list of all the available actuator endpoints.
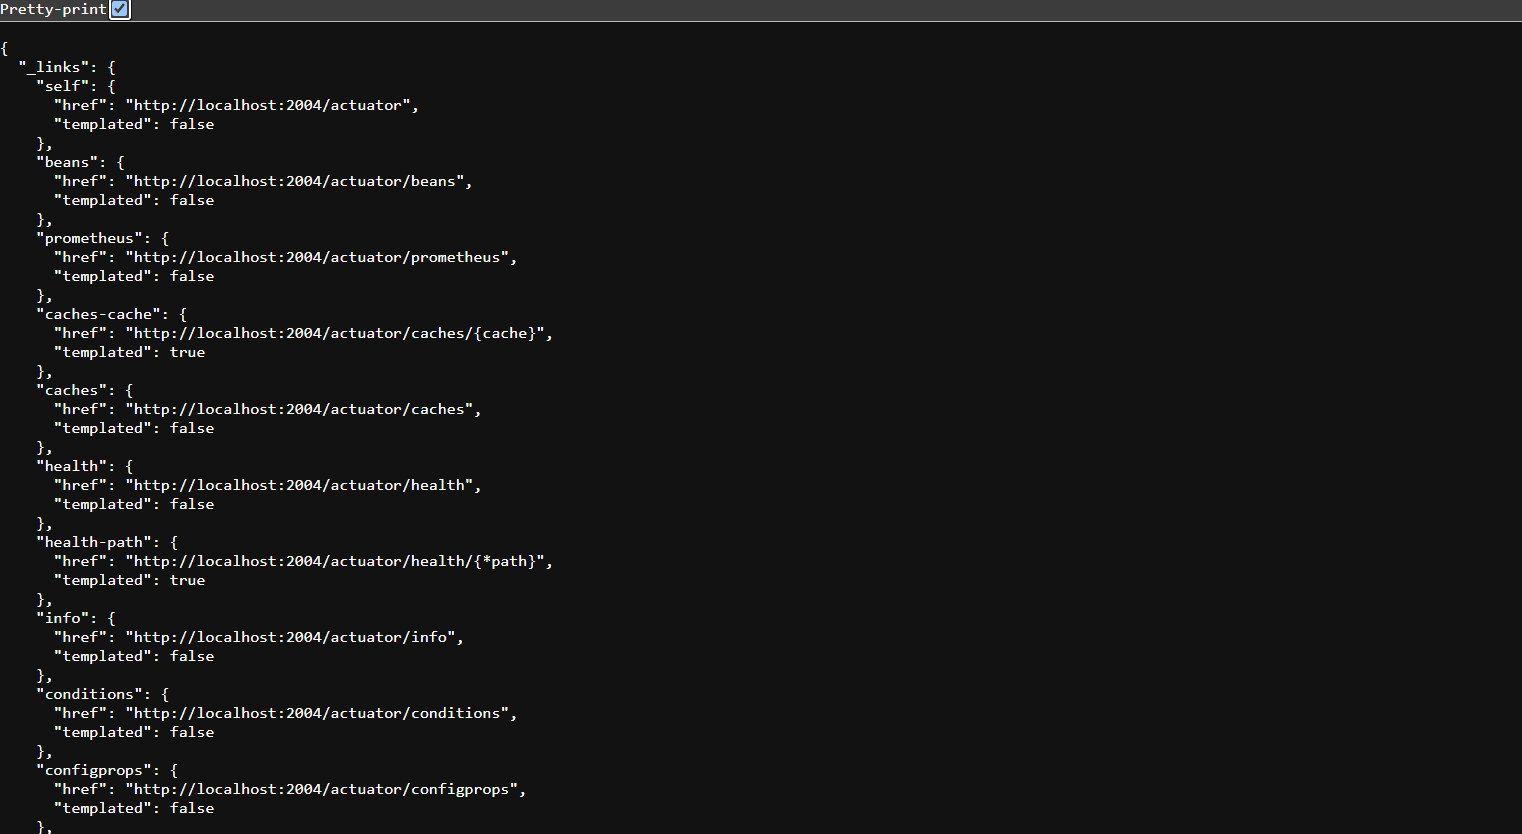
Since we require only the Prometheus endpoint, Lets enable it by adding this configuration on the application.properties /application.yml file

Now when you run the application it will give you response in the Prometheus format.
Setting up Prometheus and Grafana using Docker.
In docker-compose.yml file we will configure a prometheus to collect metrics from our application.
In a root of your project create a
docker-compose.yml:
services:
  spring-boot-app:
    build:
      context: .
      dockerfile: Dockerfile
    ports:
      - "8080:8080"
    networks:
      - monitoring

  prometheus:
    image: prom/prometheus:v2.51.2
    volumes:
      - ./prometheus.yml:/etc/prometheus/prometheus.yml
    ports:
      - "9090:9090"
    networks:
      - monitoring

  grafana:
    image: grafana/grafana:10.4.2
    ports:
      - "3000:3000"
    environment:
      - GF_SECURITY_ADMIN_PASSWORD=secret
    volumes:
      - ./grafana-data:/var/lib/grafana
    networks:
      - monitoring

networks:
  monitoring:
    driver: bridge
prometheus.yml :
global:
  scrape_interval: 15s
scrape_configs:
  - job_name: 'space-writes-dev'
    metrics_path: '/actuator/prometheus'
    static_configs:
      - targets: ['space-writes-dev:2004']
datasources.yml:
apiVersion: 1
datasources:
  - name: Prometheus
    type: prometheus
    access: proxy
    url: http://prometheus:9090
    isDefault: true
